as required by IEEE 3007
1. Capacitor Bank Aging Report
Best for: Detecting power factor correction capacitor degradation (as in your earlier example).
- Key Parameters: total_cosphi (or cosphi_l1/l2/l3) + thd_i_pct_l1/l2/l3 + voltage_v_l1_n/l2_n/l3_n
- Time Bucket: Day or Month (to smooth out daily load variations)
- Measurement Table: Daily Measurement
- Degradation Pattern to Look For:
- PF declining (e.g., 0.95 → 0.88) AND THDi rising (e.g., 3.0% → 4.5%) simultaneously over several months.
- Voltage remains stable (ruling out utility issues).
- Graph Setup: Overlay total_cosphi (left Y-axis) and thd_i_pct_l1 (right Y-axis) on the same time-series line chart.
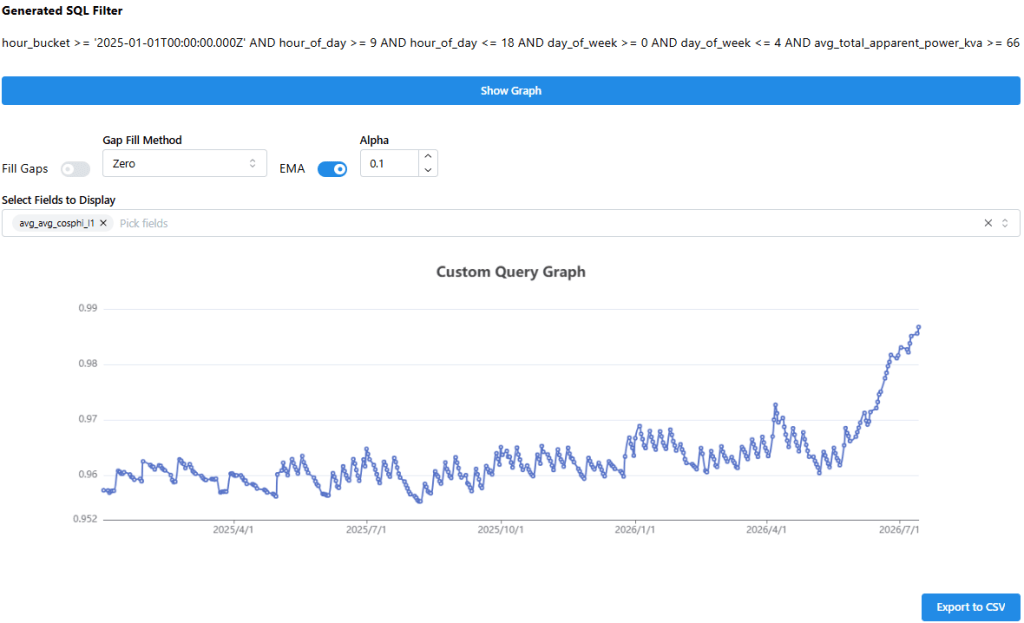
Average cosphi_l1
Average_Thd_i_pct_l1
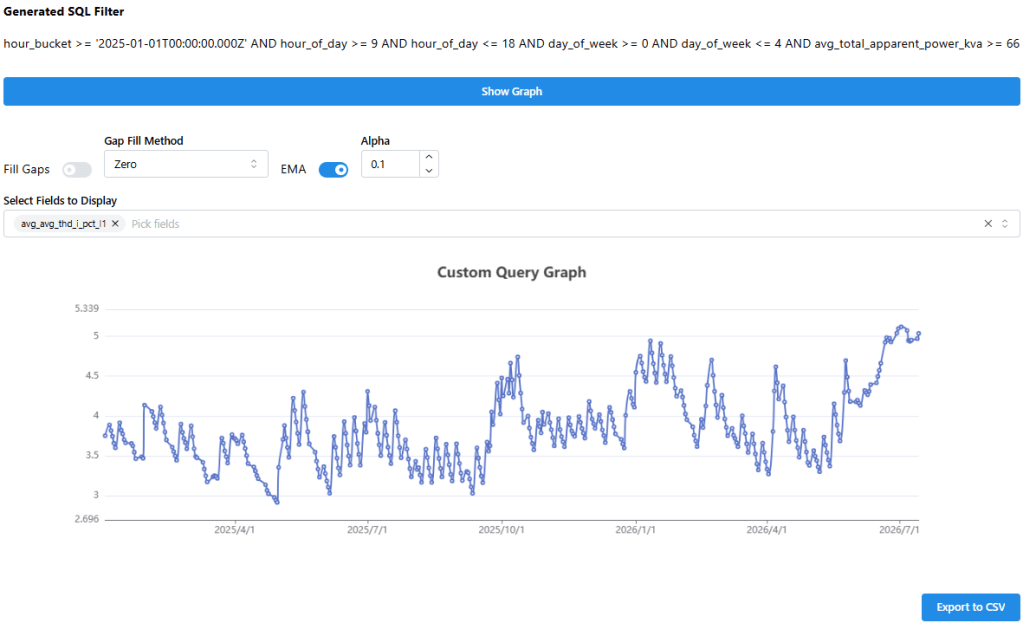
Based on historical data (graphs from Jan 2024 to Jun 2026):
- PF (Average_cosphi_l1): No degradation observed — PF is improving.
- THDi (Average_Thd_i_pct_l1): Slightly rising over several months.
However, raw historical data alone cannot confirm whether this is true degradation or simply normal load variation. The apparent rise in THDi could be due to increased harmonic loads (e.g., more VFDs or LED drivers) rather than equipment aging.
With AIPQAP’s Adaptive AI (Regression-based Prediction):
Once sufficient historical training data is collected, AIPQAP will generate:
- Predicted PF (Predicted_Average_cosphi_l1) — the expected PF under current load conditions.
- Predicted THDi (Predicted_Average_Thd_i_pct_l1) — the expected THDi under current load conditions.
The system will then continuously compare Actual vs. Predicted over time.
The real degradation trend becomes visible when:
- Actual PF is moving away (downward) from Predicted PF → indicates PF degradation.
- Actual THDi is moving away (upward) from Predicted THDi → indicates harmonic degradation.
By plotting actual and predicted values over time, we can see the true degradation slope — filtered from normal load variations — and estimate Remaining Useful Life (RUL) as required by IEEE 3007.
Current Status:
This is a new installation. AIPQAP is currently in the data collection / training phase. Predicted values are not yet available because the AI model needs sufficient historical data (typically 3–6 months) to establish a reliable “healthy” baseline. Once training is complete, the system will begin generating Predicted values and tracking Residuals automatically.
2. Harmonic Filter Detuning Report
Best for: Detecting when active/passive harmonic filters are drifting off resonance or saturating.
- Key Parameters: thd_u_pct_l1/l2/l3 (Voltage THD) + thd_i_pct_l1/l2/l3 (Current THD)
- Time Bucket: Day (use Max aggregation to capture worst-case daily distortion)
- Measurement Table: Hourly Measurement (aggregated to daily Max)
- Degradation Pattern to Look For:
- A steady upward slope in Voltage THD, even when Current THD remains flat. This indicates filter impedance is changing (capacitor degradation).
- Graph Setup: Dual-line chart showing Voltage THD vs. Current THD over 6 months.
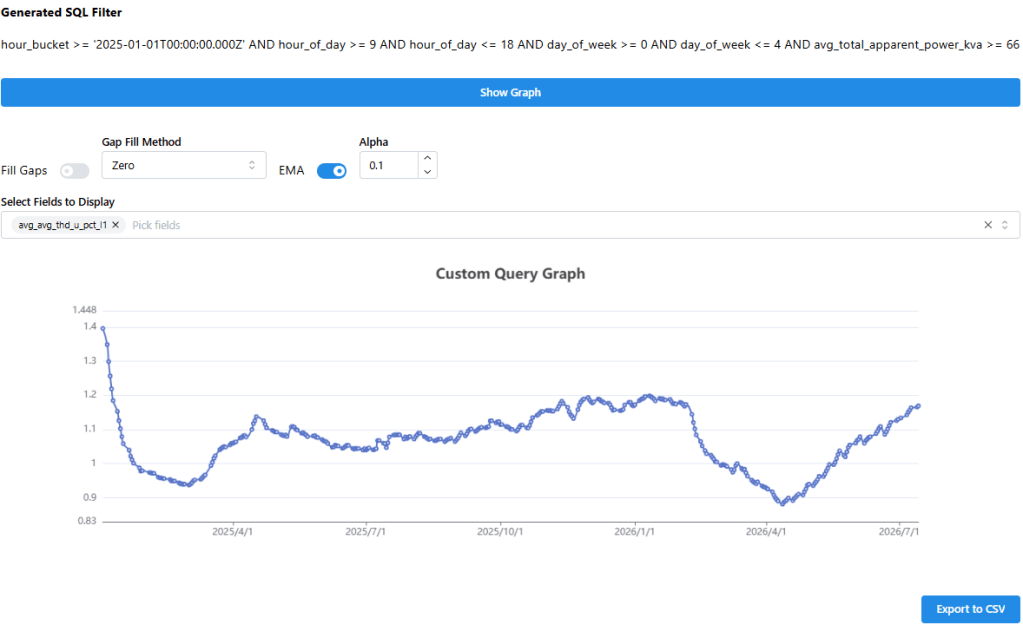
Average Voltage THD_l1
Average Current THD_l1
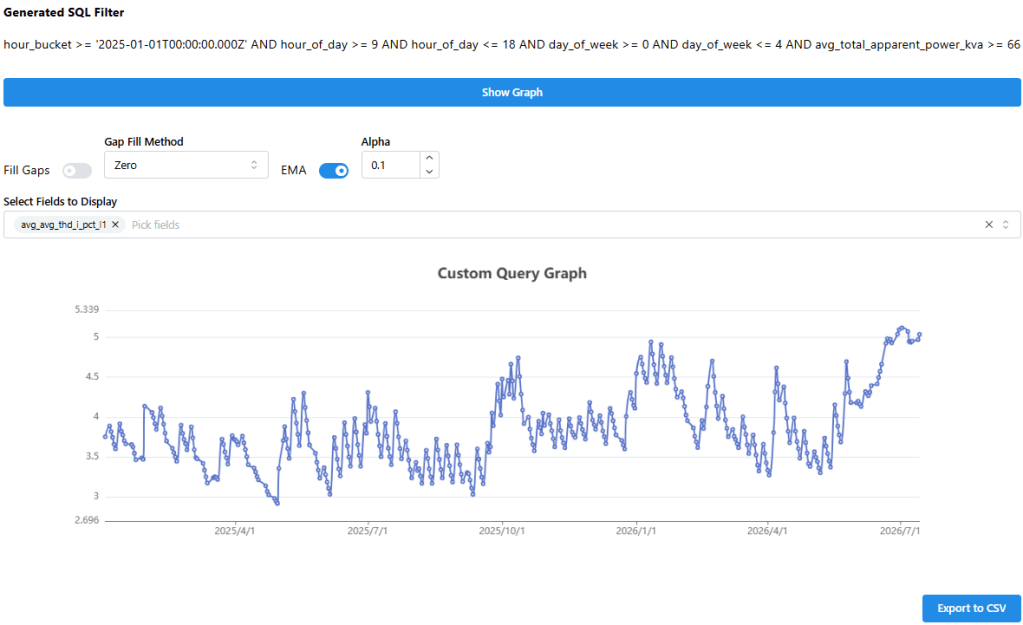
Based on historical data (graphs from Jan 2024 to Jun 2026):
- Voltage THD shows no steady upward slope.
- Current THD remains flat.
However, raw historical data alone makes it difficult to see the true trend — because normal load variations can mask or mimic degradation patterns.
With AIPQAP’s Adaptive AI (Regression-based Prediction):
Once sufficient historical training data is collected, AIPQAP will generate:
- Predicted Voltage THD — the expected value under current load conditions.
- Predicted Current THD — the expected value under current load conditions.
The system will then continuously compare Actual vs. Predicted in real-time and store the Actual and Predicted over time.
The real degradation trend becomes visible when:
- Actual Voltage THD is moving away (upward) from Predicted Voltage THD.
- Actual Current THD is moving away (upward) from Predicted Current THD.
By plotting actual and predicted values over time — rather than raw values — we can see the true degradation slope, filtered from normal load variations. This enables Remaining Useful Life (RUL) estimation as required by IEEE 3007.
Current Status:
This is a new installation. AIPQAP is currently in the data collection / training phase. Predicted values are not yet available because the AI model needs sufficient historical data (typically 3–6 months) to establish a reliable “healthy” baseline. Once training is complete, the system will begin generating Predicted values and tracking Residuals automatically.
3. Motor / Load Efficiency Decay Report
Best for: Identifying mechanical wear (friction, misalignment) in motors or compressors.
- Key Parameters: total_real_power_kw + total_reactive_power_kvar + current_a_l1/l2/l3
- Time Bucket: Month (compare same month-over-month baselines)
- Measurement Table: Daily Measurement
- Degradation Pattern to Look For:
- Current increasing gradually for the same Real Power (kW) output.
- Reactive power (kvar) increasing disproportionately (lower PF).
- Graph Setup: Scatter or line chart showing current_a_l1 vs. total_real_power_kw. If current rises while kW is constant, efficiency is dropping.
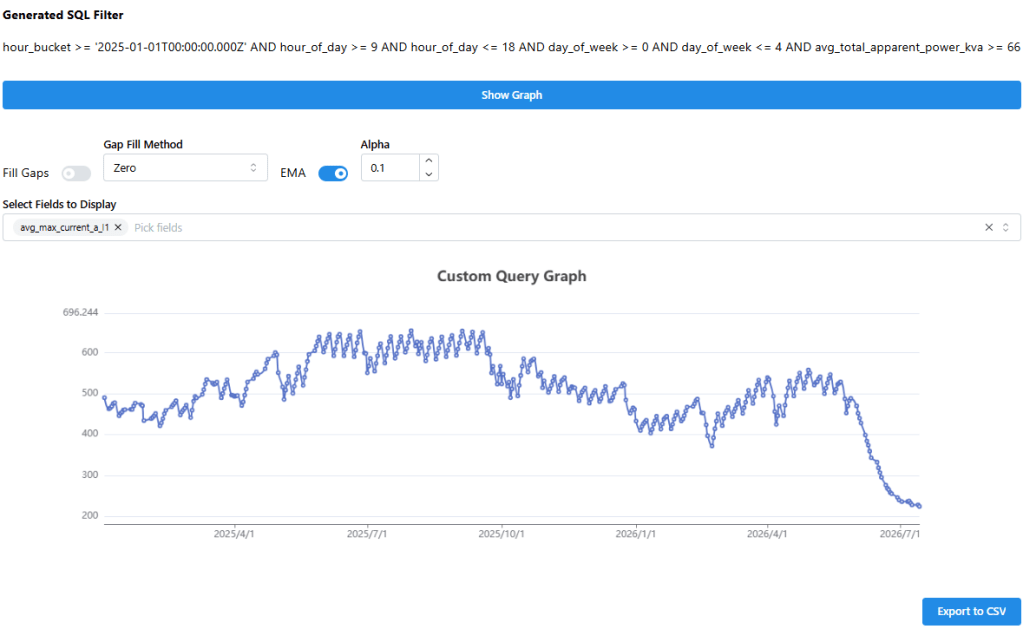
Average Max Current_l1
Average Max Real Power_l1
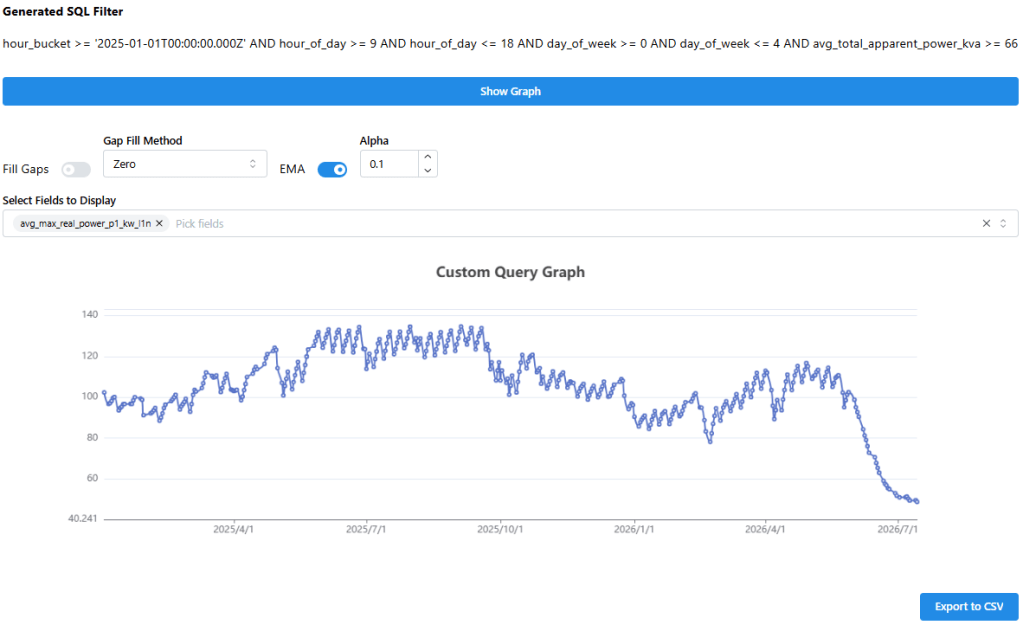
Based on historical data (graphs from Jan 2024 to Jun 2026):
- Current does not increase for the same Real Power (kW) output.
However, raw historical data alone makes it difficult to see the true trend — because normal load variations can mask or mimic degradation patterns.
With AIPQAP’s Adaptive AI (Regression-based Prediction):
Once sufficient historical training data is collected, AIPQAP will generate:
- Predicted Current — the expected value under current load conditions.
- Predicted Real Power — the expected value under current load conditions.
The system will then continuously compare Actual vs. Predicted in real-time and store both values over time.
The real degradation trend becomes visible when:
- Actual Current is moving away (upward) from Predicted Current.
- Actual Real Power is moving away (upward) from Predicted Real Power.
By plotting Actual vs. Predicted over time — rather than raw values alone — we can see the true degradation slope, filtered from normal load variations. This enables Remaining Useful Life (RUL) estimation as required by IEEE 3007.
Current Status:
This is a new installation. AIPQAP is currently in the data collection / training phase. Predicted values are not yet available because the AI model needs sufficient historical data (typically 3–6 months) to establish a reliable “healthy” baseline. Once training is complete, the system will begin generating Predicted values automatically.
4. Insulation / Leakage Current Degradation Report
Best for: Early warning of insulation breakdown (moisture, aging) in cables or windings.
- Key Parameters: current_a_n (Neutral current) + thd_i_pct_l1/l2/l3
- Time Bucket: Day (use Min/Avg to filter out transient spikes)
- Measurement Table: Record Measurement or Hourly Measurement
- Degradation Pattern to Look For:
- Neutral current rising steadily over time, accompanied by a shift in 3rd harmonic current (reflected in rising THDi on all phases).
- Graph Setup: Line chart with current_a_n as the primary metric
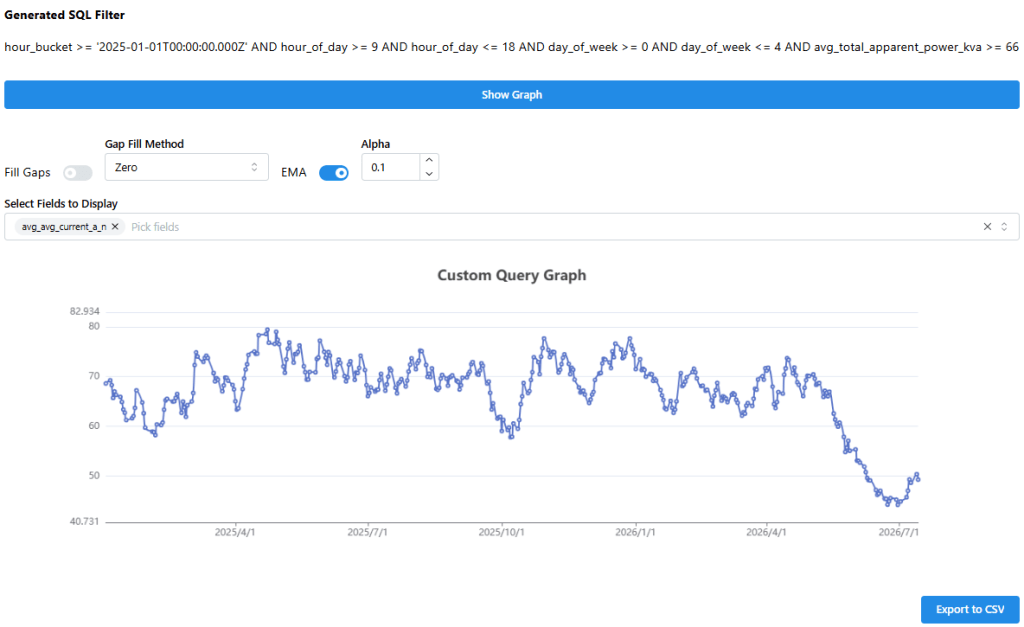
Average Current_Neutral
Average Max THDi in all 3 phases
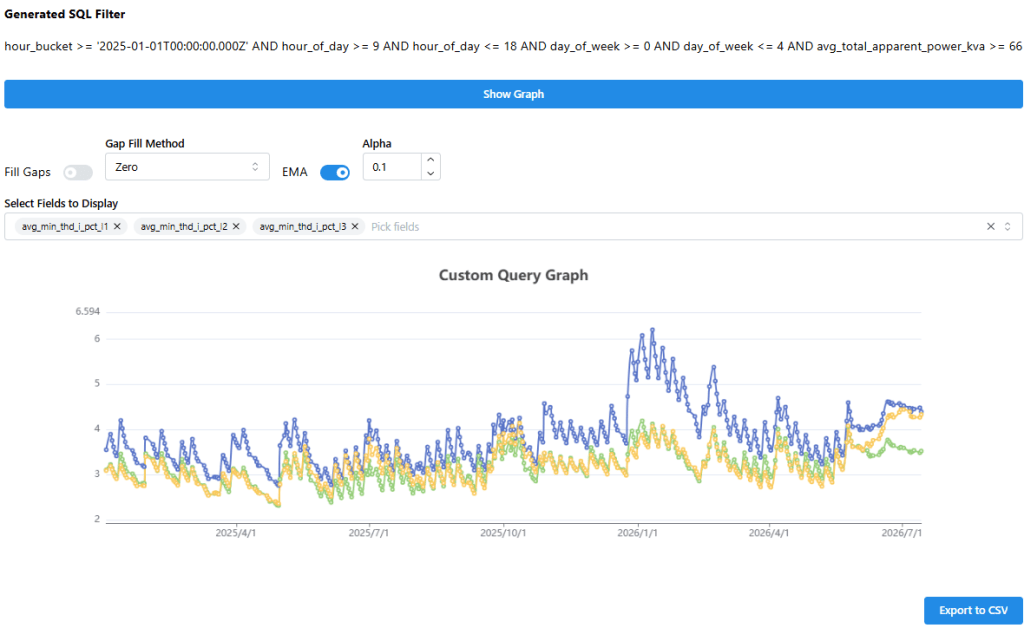
Based on historical data (graphs from Jan 2024 to Jun 2026):
- Neutral current is not rising steadily over time.
- Harmonic current (reflected in rising THDi on all phases) is not showing a sustained increase.
However, raw historical data alone makes it difficult to see the true trend — because normal load variations can mask or mimic degradation patterns.
With AIPQAP’s Adaptive AI (Regression-based Prediction):
Once sufficient historical training data is collected, AIPQAP will generate:
- Predicted Neutral Current — the expected value under current load conditions.
- Predicted Harmonic Current (THDi) — the expected value under current load conditions.
The system will then continuously compare Actual vs. Predicted in real-time and store both values over time.
The real degradation trend becomes visible when:
- Actual Neutral Current is moving away (upward) from Predicted Neutral Current.
- Actual Harmonic Current (THDi) is moving away (upward) from Predicted Harmonic Current.
By plotting Actual vs. Predicted over time — rather than raw values alone — we can see the true degradation slope, filtered from normal load variations. This enables Remaining Useful Life (RUL) estimation as required by IEEE 3007.
Current Status:
This is a new installation. AIPQAP is currently in the data collection / training phase. Predicted values are not yet available because the AI model needs sufficient historical data (typically 3–6 months) to establish a reliable “healthy” baseline. Once training is complete, the system will begin generating Predicted values automatically.
5. Voltage Sag Susceptibility / Supply Weakness Report
Best for: Detecting deteriorating grid connection or failing upstream transformers.
- Key Parameters: voltage_v_l1_n/l2_n/l3_n (Min aggregation) + frequency_hz
- Time Bucket: Hour (to capture daily lows) and Month (long-term trend)
- Measurement Table: Record Measurement
- Degradation Pattern to Look For:
- The minimum daily voltage is drifting progressively lower over months (e.g., 218V → 213V at peak load), indicating rising supply impedance.
- Graph Setup: Plot the daily minimum of voltage_v_l1_n over a 12-month rolling period.
Average Min Voltage Neutral on 3 phases
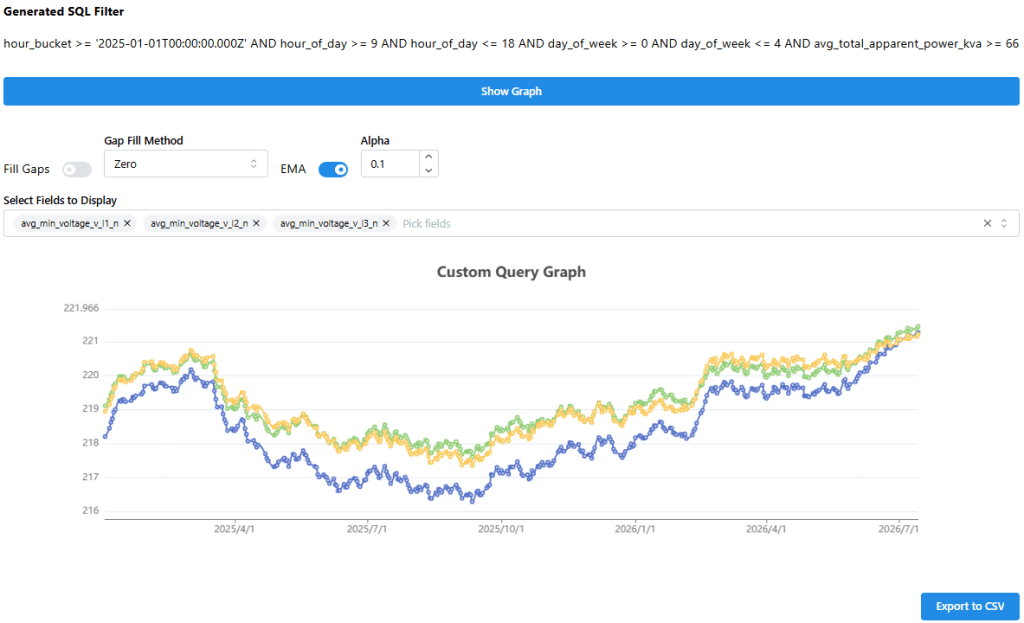
Based on historical data (graphs from Jan 2024 to Jun 2026):
- The minimum daily voltage is not drifting progressively lower over months.
However, raw historical data alone makes it difficult to see the true trend — because normal load variations can mask or mimic degradation patterns.
With AIPQAP’s Adaptive AI (Regression-based Prediction):
Once sufficient historical training data is collected, AIPQAP will generate:
- Predicted Minimum Daily Voltage — the expected value under current load conditions.
The system will then continuously compare Actual vs. Predicted in real-time and store both values over time.
The real degradation trend becomes visible when:
- Actual Minimum Voltage is moving away (downward) from Predicted Minimum Voltage.


Leave a comment